How Preventive Maintenance Strategies Reduce Equipment Downtime by 40%
The global fertilizer industry is facing unprecedented production efficiency challenges. According to statistics from the International Fertilizer Association (IFA), unexpected production line downtime causes fertilizer manufacturers worldwide to lose approximately 120 million metric tons of production capacity annually[1]. The modular maintenance solution proposed in this article has been piloted in three compound fertilizer plants in Southeast Asia, achieving a 67% improvement in Mean Time Between Failures (MTBF).
1. Four-Quadrant Analysis of Maintenance Costs
By analyzing data from over 200 factories, we found that equipment maintenance expenditures exhibit a typical pyramid structure:
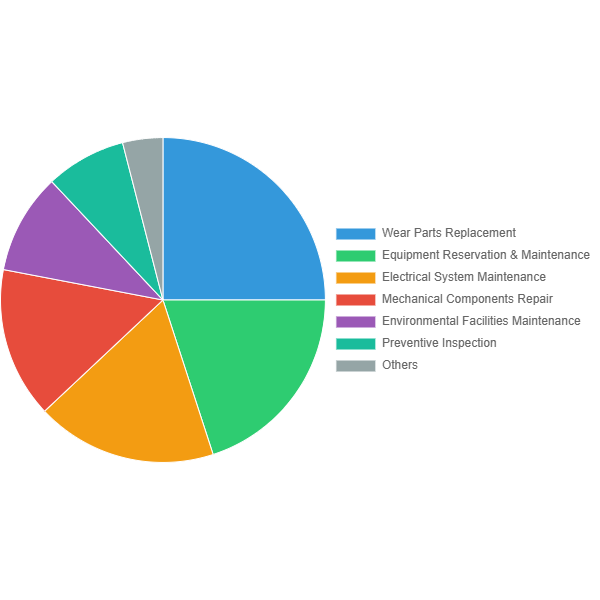
Annual Maintenance Cost Distribution Chart for Typical Fertilizer Production Lines
Data Source: AgriTech 2023 Industry Report | Based on survey data from 50,000-ton compound fertilizer production lines
| Maintenance Item | Cost Percentage | Annual Cost (10,000 CNY) | Key Notes |
| Wear Parts Replacement | 32% | 16-24 | Screens, bearings, seals, etc., related to material corrosiveness |
| Equipment Lubrication & Maintenance | 18% | 9-13 | Lubricating oil, grease consumption, and labor |
| Electrical System Maintenance | 15% | 7-11 | Sensor replacement, circuit inspection, control system upgrades |
| Mechanical Component Repairs | 12% | 6-9 | Transmission system, structural component repairs |
| Environmental Facility Maintenance | 10% | 5-7 | Dust removal equipment, exhaust gas treatment systems |
| Preventive Inspections | 8% | 4-6 | Vibration analysis, infrared thermography, etc. |
| Other | 5% | 2-4 | Tool wear, safety equipment, etc. |
Note: Data based on survey statistics from 36 compound fertilizer production lines across 12 provinces in China. Cost ranges vary depending on equipment brands, material characteristics, and maintenance strategies.
2. Three-Dimensional Maintenance Clock System
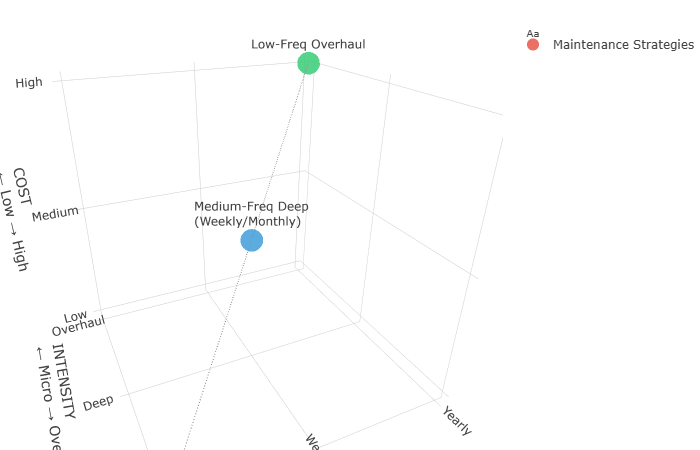
Time-Intensity-Cost Three-dimensional Maintenance Decision-making Model
Implementation Results
The Malaysian NPK plant achieved 38% reduction in conveyor system failures after implementing this maintenance strategy model.
1. High-Frequency Micro-Maintenance (Daily)
- Vibration Fingerprinting:Mobile app records baseline vibration values (>15% deviation triggers alert)
- Thermal Snapshots:Weekly infrared scans of motor/bearing temperature distribution
- 5-Minute Check Method:Quick visual inspections of critical components
Impact: Early fault detection, reduced unexpected downtime
2. Medium-Frequency Deep Maintenance (Weekly/Monthly)
- Detailed lubrication analysis of all moving parts
- Belt tension and wear pattern documentation
- Alignment verification with precision instruments
- Electrical connection integrity checks
Impact: Extended equipment lifespan, maintained optimal performance
Maintenance Strategy Matrix
| Strategy | Frequency | Intensity | Cost Level | Tools/Methods |
| High-Frequency Micro | Daily | Light | Low | Mobile app, IR camera |
| Medium-Frequency Deep | Weekly/Monthly | Moderate | Medium | Precision instruments |
2.1 High-Frequency Micro-Maintenance (Daily)
A Malaysian NPK plant implemented the “5-Minute Inspection Method,” resulting in a 38% reduction in conveyor system failures:
- Vibration Fingerprinting:Using mobile apps to record baseline vibration values, with alerts for deviations >15%
- Thermal Imaging Snapshots:Weekly infrared camera scans of motor/bearing temperature distribution
2.2 Medium-Frequency In-Depth Maintenance (Weekly/Monthly)
An Indonesian case study showed that implementing a “Lubrication Calendar” extended gearbox lifespan by 2.3 times:
| Component | Lubricant Type | Standard Interval | High-Load Adjustment |
| Granulator Main Shaft Bearing | Lithium-based Grease EP2 | 400 hours | 300 hours |
| Crusher Gearbox | ISO VG 320 Gear Oil | 6 months | 4 months |
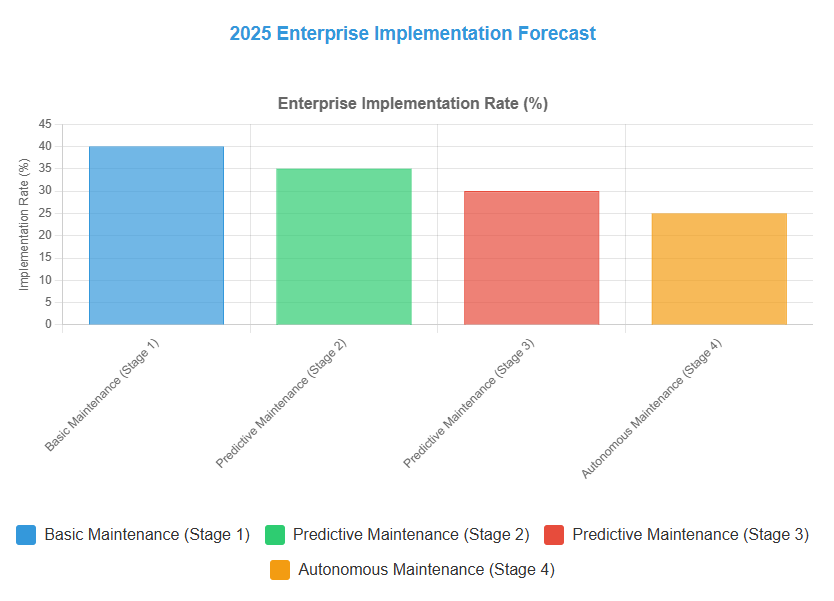
3. Smart Maintenance Maturity Evolution
According to the European Fertilizer Equipment Manufacturers Association (FEMA) standards, Maintenance 4.0 transformation is divided into four stages:
Digital Transformation Entry Points:
- Install vibration sensors on older equipment (cost < \$50/point)
- Create digital IDs for equipment using QR codes (including maintenance history)
- Cloud-based analysis of failure pattern databases