
In fertilizer production, the residence time of materials within the mixer directly affects the spatial uniformity of nutrient distribution. Too short a time results in insufficient mixing, while too long a time increases energy consumption and may lead to particle breakage or stratification. This paper systematically examines the uniformity variation under different mixing times through a series of controlled experiments, providing data support for process parameter optimization.
Design of Mixing Time Variables
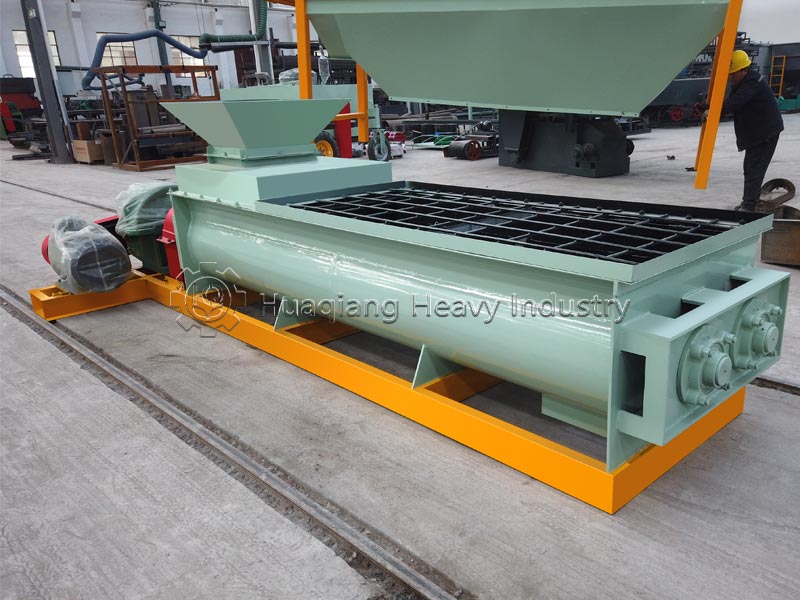
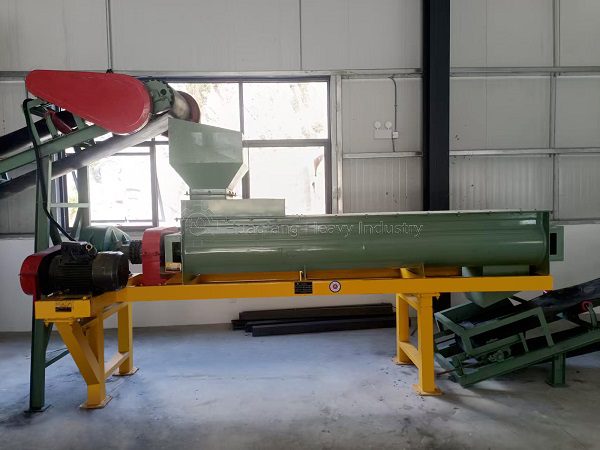
The experiment used a double-shaft paddle mixer with a volume of 2.5 m³ and a filling rate of 60%. Using an NPK 15-15-15 compound fertilizer formula (raw materials: urea, monoammonium phosphate, potassium chloride, and filler) as the model, five mixing time gradients were set: 30 seconds, 60 seconds, 90 seconds, 120 seconds, and 180 seconds. Each gradient was repeated three times. After mixing, the mixer was stopped, and 200 g samples were taken from different locations in the material pile (four corners and the center), for a total of five samples per batch.
Sampling Analysis and Detection Indicators Each sample was pulverized and passed through a 100-mesh sieve. The fractions were reduced using the quartering method, and the nitrogen, phosphorus, and potassium contents were rapidly determined using near-infrared spectroscopy. The coefficient of variation (CV, %) was used as the uniformity evaluation index. The CV value was calculated as: CV = (standard deviation/mean) × 100%. Industry standards require: CV ≤ 10% is acceptable, ≤ 5% is excellent.
Simultaneously, the peak current and energy consumption of the mixer at each mixing time were recorded to assess economic efficiency.
III. Analysis of Coefficient of Variation Curves and Conclusions
30 seconds: Nitrogen CV was as high as 18.2%, phosphorus 15.7%, and potassium 19.4%. Visible unevenness in material color and localized urea agglomeration were observed. This indicates severely insufficient mixing time.
60 seconds: Nitrogen CV decreased to 9.8%, phosphorus 8.3%, and potassium 10.1%, just entering the acceptable range. However, visual differences were still apparent between samples, with slightly more potassium salt at the bottom.
90 seconds: Nitrogen CV 4.2%, Phosphorus 3.5%, Potassium 4.8%, reaching excellent levels. Nutrient deviations for all samples were within ±0.3%, indicating optimal mixing uniformity.
120 seconds: Nitrogen CV 4.5%, Phosphorus 3.8%, Potassium 5.1%, no significant difference from 90 seconds (p>0.05), but a slight increase in current indicates that some materials have begun to overmix (no stratification occurred, but energy consumption increased by 8%).
180 seconds: Nitrogen CV rose to 6.3%, Phosphorus 5.9%, Potassium 7.2%. Sampling revealed a higher proportion of fine powder at the bottom, indicating that prolonged stirring caused the heavier potassium salts to slightly settle, resulting in a “reverse mixing” stratification phenomenon. Simultaneously, particle surface wear increased, and the powder content increased by 2.5%.
The coefficient of variation curve is L-shaped: uniformity rapidly improves in the first 60 seconds, reaches its lowest point at 90 seconds, and then flattens out or slightly rebounds after 120 seconds. Therefore, the optimal mixing time is determined to be 90 seconds, at which point the CV (coefficient of variation) is <5%, and energy consumption is reduced by 10% compared to 120 seconds.
Production Recommendations
For double-shaft paddle mixers, the recommended residence time for conventional materials (80-mesh particle size ≥90%, moisture ≤4%) is 90-120 seconds, with 90 seconds being preferred.
If the formula contains raw materials with significant differences in specific gravity (such as potassium salts and straw powder), the residence time can be appropriately shortened to 75-85 seconds, and the lighter materials should be pre-wetted before mixing.
The gap between the mixer paddles and the casing should be calibrated (≤5mm) every 200 hours of production. Severely worn paddles will significantly prolong the required mixing time.
Summary: Longer residence time is not always better. Through sampling analysis and coefficient of variation curves, the optimal balance point between “uniformity and energy consumption” can be accurately found. Regularly conducting such experiments can help fertilizer plants optimize the mixing process and ensure the stable and reliable fertilizer effect of each bag of product.
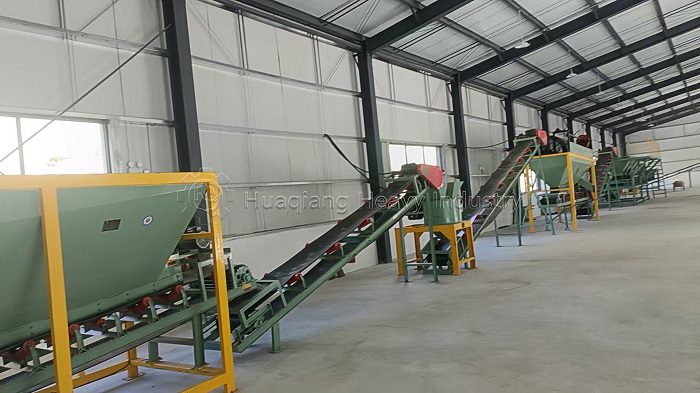
The coefficient of variation curve clearly demonstrates that for a double-shaft paddle mixer, the optimal mixing time is not a fixed rule but a precise balance point—90 seconds in this study—where nutrient uniformity (CV < 5%) and energy efficiency converge. This finding is directly applicable to the entire fertilizer production train. After the fertilizer crusher and mixer achieves the target homogeneity, the well‑blended material proceeds to the fertilizer granulator machine—whether a disc granulator machine in an organic fertilizer disc granulator system or a rotary drum unit, as part of a complete disc granulation production line—where uniform feedstock ensures consistent granule size and nutrient content. Subsequently, fertilizer screening equipment removes off‑spec particles, and the final product meets strict quality standards. Moreover, the same mixing principle applies to other fertilizer equipment in the line: for organic fertilizers with fibrous materials, a slightly shorter residence time (75‑85 seconds) prevents segregation of light and heavy components. Regular wear checks of the paddles and gap calibration (≤5 mm) are essential to maintain the 90‑second optimum, as worn paddles lengthen the required mixing time and increase energy consumption. By integrating the mixing time optimization with downstream granulation and screening, producers can reduce overall energy use by 8‑10% while ensuring that every bag of fertilizer delivers the promised nutrient profile—a win‑win for both quality control and operational cost management.